

Performance is a complicated beast. Each step in the problem solving chain of performance issues - identification, diagnosis, rectification and verification, pose unique challenges. This post will deal with themes from the first two steps, and is aimed at teams who are already conducting some form of performance testing (if don't currently have an automated load testing solution then Gatling is a great way to get started).
Even if you do have tests set up, then without a decent logging and analytics solution you're losing most, if not all, of the value of the tests themselves. It is vital to see historic trends, along with daily results in order to identify potential issues. Here you'll learn how to set-up Gatling with the Elasticsearch, Kibana, and Logstash (ELK) stack for effective performance monitoring.
Setup
The two pieces of software that are specific to this guide are Gatling, and the ELK stack. The former is a well-developed and feature-packed load testing tool. With Scala & Akka under the hood, Gatling has first-class concurrency support to really stretch the capabilities of your applications and the web servers they are standing on. If you're not familiar with Gatling I recommend you take a quick look at it's documentation to get a feel for how it works. It's more likely that you've heard of, or even currently use, the ELK stack. Here I assume you indeed have this running, or are thinking about deploying it in your environments. If you would like to know how, the official docs are a good start. For something more guided check out this tutorial.
A Quick Word on Gatling
By default Gatling produces visually rich and informative HTML reports. They are based on your simulations in the load testing project. You might have one which is a CreateUserSimulation, where you define the requests/payloads required to create a user in your app. When this simulation is run, Gatling creates a sub-directory for this test with the simulation log and the HTML reports inside. So when you have N simulations, Gatling produces N folders containing their results. Under this architecture Gatling executes all of your simulations independently, and serializes their results in separate sub-directories.
Here's an example line from the simulation.log mentioned above:
Scenario 'Create user and log in' 7811013317382418981-2 REQUEST Submit register request 1459318868831 1459318868832 1459318870174 1459318870174 OK
Which represents the following information:
Scenario Scenario name Scenario ID Request name Request start Request end Response start Response end Status
We're interested in the request start and response end metrics to get the end-to-end request duration, along with status which indicates if the request met our expectations - i.e. if the API responded with 201 Created in this case.
Configuring Gatling
The HTML reports are great for manual inspection after a load test, however they don't provide much benefit in our aim for an automated solution. So we should disable them by creating (or appending to, if you already have one) a gatling.conf file, with the following:
gatling {
  charting {
    noReports = true
  }
}
This results in Gatling only outputting simulation.log files in the subdirectories of each simulation that gets run. These files are where all of the metrics are stored for the simulation results, and are what we will be feeding into Elasticsearch - more on that later.
A little dirty work
To make things easier for ourselves we'll glue together all of the simulation.log files that are spread across N directories for each simulation that we have run. You could do this in many ways, personally this sounds like a task well-suited for some quick bash hackery ;]
#!/bin/bash
GATLING_TARGET = "/path/to/target/gatling" # Set to wherever this script is relative to your Gatling project's root directory.
cd $GATLING_TARGET

find . -type f -name 'simulation.log' -exec cat {} + >> /path/to/output.log
rm -r $GATLING_TARGET/* # [Optional] Clean up the original log files
When we run this we get one output.log file which contains all of the data from the simulations that have run.
Configuring Logstash
Thankfully since the logs are in a structured format we can parse them pretty easily using existing Logstash inputs. We'll be using the grok plugin, which is basically just an abstraction over regular expressions to parse the lines from the ouput.log file. After some quick filtering and simple arithmetic we'll have useful data to send to Elasticsearch.
This is an annotated example of a logstash.conf file that performs the logic above. If you're familiar with configuring Logstash then you skip the following section and skim the entire config file yourself.
For some background and more information about configuring Logstash you may find the documentation here.
A walk through logstash.conf
The first section of the config is the input block. This simply opens the file that we produced from our script above.
file {
  type           => "gatling"
  path           => "/path/to/output.log"
  start_position => "beginning"
}
The filter block is the most involved section of the configuration, so let's go through it line by line.
First we perform some simple data cleaning. Gatling logs the start and end of simulations, along with which group the requests belong to. We can ignore these lines.
if ([message] =~ "\bRUN\b" or [message] =~ "\bSTART\b" or [message] =~ "\bEND\b" or [message] =~ "\bGROUP\b") {
  drop { } // Reject unwanted lines
}
Include the if [type] == "gatling" statement if you process other kinds of logs. However in practice you might want to split the config files up, to avoid having a single large file with everything mixed in it.
Here the grok plugin is used to define parsing. We specify the type of data we're expecting, and assign them names to reference them later.
grok {
    match => { "message" => "%{DATA:scenario_name}\t%{NOTSPACE:user_id}\tREQUEST\t%{DATA:group}\t%{DATA:name}\t%{INT:requestStart:int}\t%{INT:requestEnd:int}\t%{INT:responseStart:int}\t%{INT:responseEnd:int}\t%{WORD:status}" }
}
Gatling denotes a successful response with "OK", and a failed one with "KO". Let's convert them into something more useful. While we're at it let's remove a few redundant fields.
mutate {
    gsub => [
        "status", "OK", true,
        "status", "KO", false
    ]
    remove_field => ["host", "path", "type"] // If you have use for these then don't remove them.
}
To ensure Elasticsearch properly maps the fields we send to it from Logstash, we must indicate that the status field is a boolean.
mutate {
    convert => { "status" => "boolean" }
}
The timestamp of the log line, used in visualizations and data aggregation.
date {
    match => [ "requestStart", "UNIX_MS" ]
}
Here we use some Ruby to get the end-to-end responseDuration, which from what you may see is determined by the difference between when the request was first sent to when eventually the server responded.
ruby {
    code => "event['responseDuration'] = (event['responseEnd'] - event['requestStart'])"
}
That's it for a basic filter block which handles the logic of parsing and munging the Gatling logs. The only thing left is to specify where to send the log data, in our case that is elasticsearch. Luckily there's a great plugin that handles connecting to ES for us.
Replace the host name with whatever is appropriate. If the name of the index looks funny that's because it is an index template, more on that in a second. Finally we let ES know that we will be sending it json with the codec => "json" statement.
output {
     elasticsearch {
        hosts => ["localhost:9200"]       // Replace with your host name.
        index => "gatling-%{+YYYY.MM.dd}"
        codec => "json"
    }
}
Whilst that was fairly wordy I hope that it was pretty straight-forward. There's nothing inherently difficult in configuring Logstash for this case, just a little bit of creativity and flexibility is required.
Prepare Elasticsearch
I've included a script that setups up an Elasticsearch template with the appropriate mappings for the data we'll produce from Logstash. The name of the template is gatling-*. This means that any index created that matches this pattern will be configured with the properties of this template. This gives us control over the way in which Elasticsearch maps the data it gets from Logstash.
It's important to indicate in the template that the string fields should not be analyzed by ES. Otherwise if there's a simulation named "Create admin account" for instance, it will be tokenized into "create", "admin", "account" which will make any aggregations based on simulation names very difficult in Kibana.
That's all we really need to do with ES in order for this pipeline to work.
Kibana
The last component in the pipeline, and from which we get all of the value, is Kibana. Here we'll be creating visualizations in order to be able to quickly analyze performance metrics.
Pulling data from ES indexes using Kibana is dead simple and goes to show how well the ELK stack works together.
The first step is to let Kibana know about the gatling-* indexes we will be creating in Elasticsearch. This is easily done through the Settings panel, shown below.

kibana - 1.png
Verify that Kibana is able to pull data from ES through the Discover pane:

kibana - 2.png
Visualizations
From here your imagination is the limit. Kibana has a range of visualizations each with their own unique properties. Here's two that I find useful:
Individual Request median time
The first red bar is the 50th percentile, i.e. the median. The blue and green represent the 95th and 99th percentiles, respectively. From here we can quickly determine the slowest requests that most users encounter, and any requests that take extraordinarily long (i.e. the outliers in the 95/99 percentiles).

kibana - 3.png
Daily global median response time
A quick and easily digestible metric - the global median of all the requests durations on a given day. With this chart it is easy to visualize the long-term trends in your applications performance Keep an eye out from any irregular deviations and investigate accordingly.
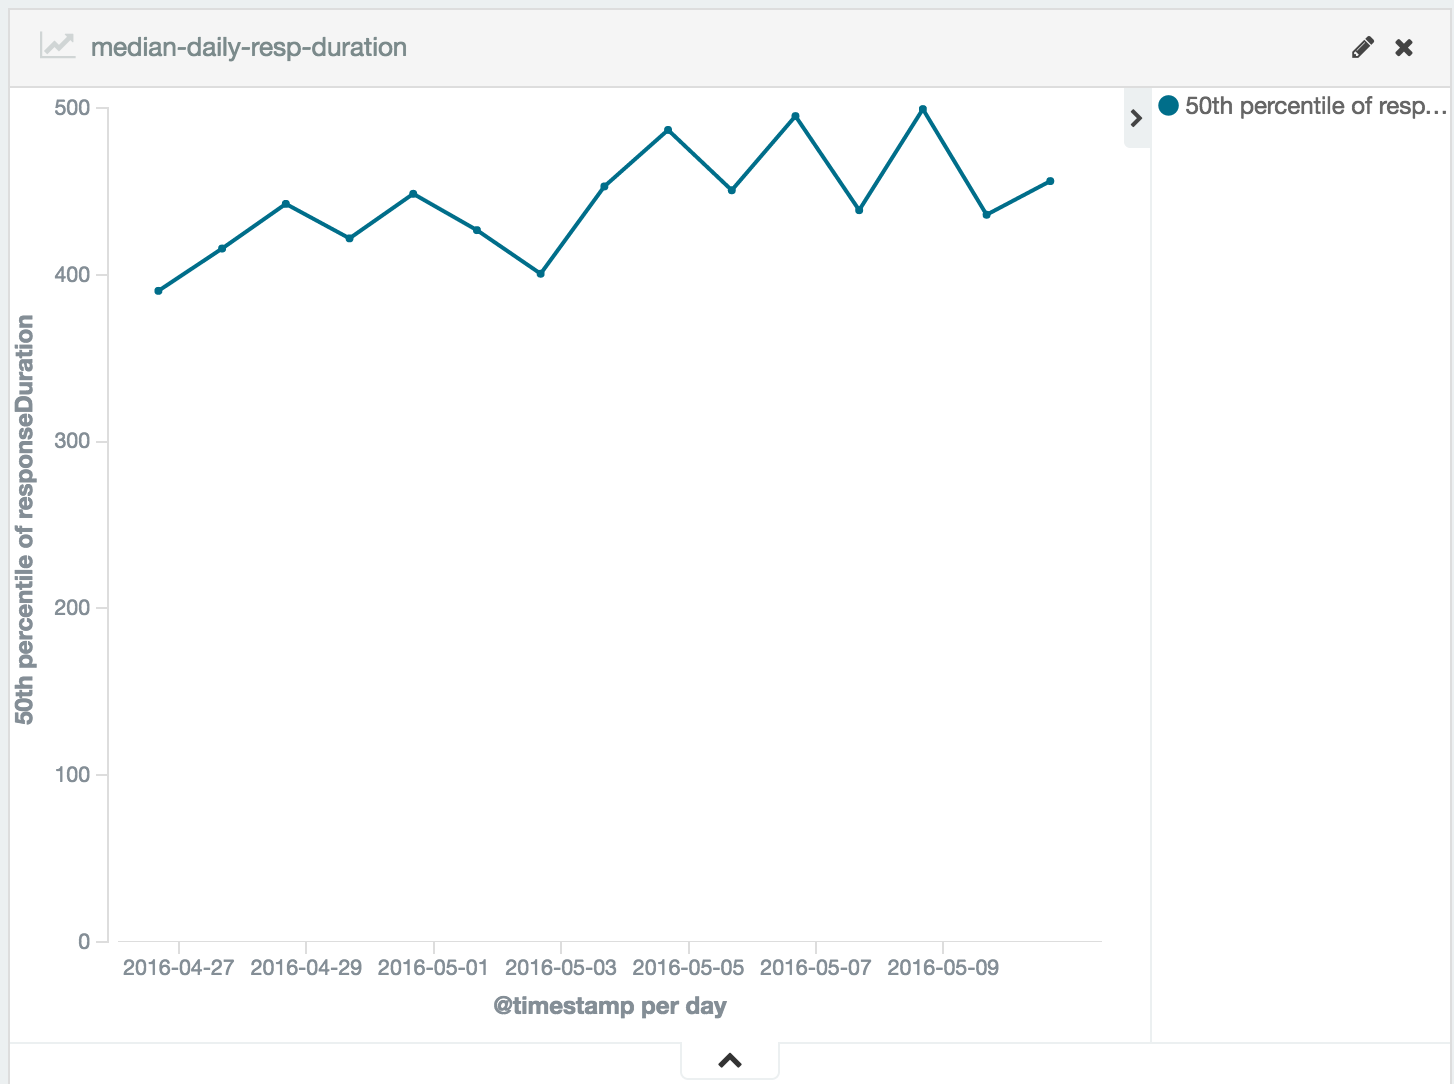
kibana - 4.png
For some more detail on constructing insightful and statistically sound metrics take a look at this post for starters.
It works!
So now running a Gatling simulation results in an immediate update to our graphs in Kibana so that we can keep an eye on the performance of our application.
The data from the simulations is all about request/response time, another vital set of metrics is how the JVM and hardware cope when under high load - i.e. our load tests. A great way gathering this information is running JMX monitoring on the application, which reports CPU and RAM usage, JVM statistics and so on. We can also hook up this data into ELK, and how to do this might be a post for another time.
With Gatling and the ELK stack we now have an easy way to visualize trends in our application's performance, and are now much more likely to identify any issues that may arise over time.